 What is the Last Frost Date for my Planting Zone?
Caution: Using your planting zone to determine your last frost date is a very inaccurate way of figuring out when it will be safe to plant your vegetable starts and seeds, and should not be relied upon. Instead, use NOAA’s Satellite and Information Service page to look up your last frost date by city or name of region. Do not trust any planting zone frost date chart which lists last frost date or date ranges per zone, as last frost date and zones are not specifically correlated. Planting zones are defined by minimum extreme temperatures, while last frost date depends on specific regional and micro-climate environments. Especially in today’s world of new climate extremes, you must pay attention to local indicators and weather forecasts and use frost protection strategies if you plan to push the envelope.
Example:
Portland, Oregon – Zone 8. According to NOAA’s table for Oregon, the chance of frost is less than 10% after April 15th. But if you went with any of the popular last frost date by zone tables, you might plant your seeds as early as March 15th. However, on March 15th, according to NOAA’s climate data, you’re still 10 days out from even a 50/50 chance of no frost!
To find out what planting zones are really based on, keep reading.

Planting Zones
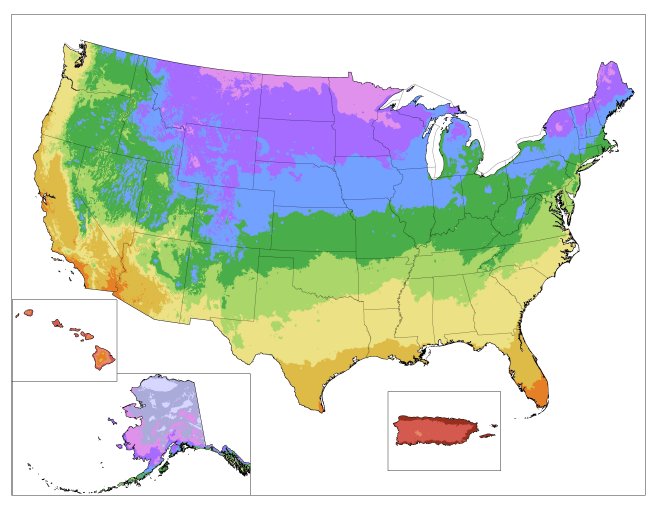
The USDA Hardiness Zones Map is a long standing and widely recognized measure of climate and seasons for planting zones throughout the United States.
Most recently revised in 2012, the Plant Hardiness Zones Map is now more specific than ever before, GIS based, and employs an impressive new algorithm to deliver highly specific local interactive information.
As stated on the USDA 2012 PHZM introduction:
“The 2012 USDA Plant Hardiness Zone Map is the standard by which gardeners and growers can determine which plants are most likely to thrive at a location. The map is based on the average annual minimum winter temperature, divided into 10-degree F zones.”
 As you can see on the key for the 2012 Plant Hardiness Zone Map key, the planting zones are calculated based on the average annual extreme minimum temperature. In each section of the key you are provided with the planting zone number/letter (e.g. 5a, 5b, 6a, 6b etc. through the scale.) Next is the Temperature, which is actually the extreme minimum temperature for that zone in the sample winter period.
Using the interactive map you can actually zoom in close enough to be able to select their own city or even small town. The higher the resolution of the map the more detailed the zone information becomes, so that areas which appear to be generally in, for example, planting zone 7a can be seen to be more specifically in planting zones 6a, 7a or 7b depending on their exact specific data for a location within the larger area.
By selecting a point on the map you can bring up a dialogue box containing the zone, average extreme minimum temperature, average extreme minimum temperature range, and exact, latitude and longitude for the selected location.
Here is what the USDA has to say about their new map:
This edition of the USDA Plant Hardiness Zone Map (PHZM) is GIS (Geographic Information System)-based for the first time. This is also the first USDA PHZM that is specifically designed for the Internet. It enables viewers to examine plant hardiness zones at a much finer scale than ever before. For the first time, a very sophisticated algorithm was used to interpolate low-temperature values between actual weather reporting stations. A personal ZIP Code zone finder is also included with this version of the map. Simply type your ZIP Code in the proper box and your zone will be reported.”
New Data
Zones in this edition of the USDA Plant Hardiness Zone Map (PHZM) are based on 1976–2005 weather data. A trial check did not find that the addition of more recent years of data made a significant difference in the definition of these zones. Each zone represents the mean extreme minimum temperature for an area, calculated from the lowest daily minimum temperature recorded for each of the years 1976–2005. This does not represent the coldest it has ever been or ever will be in an area, but it simply is the average of lowest winter temperatures for a given location for this time period.
The previous edition of the USDA PHZM, revised and published in 1990, was drawn from weather data for 1974–1986. The longer period (30 years) of data was selected by the group of horticultural, botanical, and climatological experts who led the review of the latest revision as the best balance between smoothing out the fluctuations of year-to-year weather variation and the concept that during their lifetimes, perennial plants mostly experience what is termed “weather” rather than “climate.”
Finer Scale
Because this map was created digitally with GIS technology, it has a higher level of resolution and can show smaller areas of zone delineations than ever before. For example, cities tend to hold more heat because they have large amounts of concrete and blacktop, so a city or town may be assigned to a zone warmer than the surrounding countryside. Higher elevations tend to be colder than surrounding lower areas, so the top of a mountain may be an area of cooler zones. A location near a large body of unfrozen water may provide milder winter weather and be in a warmer zone.
New Zones
Two new zones have been added to this edition of the USDA PHZM. Zones 12 and 13 have been introduced for regions with average annual extreme minimum temperatures above 50 degrees and 60 degrees F, respectively. They only appear on the maps for Hawaii and Puerto Rico. But the additional frost-free zones will enable better definition of conditions for tropical and semitropical plants, which often serve as house or patio plants in many parts of the country. The two new zones will provide a way to share information about differences in cold sensitivity of tropical ornamental plants and may help gardeners decide when to bring tropical plants indoors from a deck or patio as the temperature cools.
Using the 2012 USDA Plant Hardiness Zone Map cannot ensure you will avoid all plant damage or loss of plants due to cold or severe weather, however it is a good guideline and because it is so well recognized, you can find the planting zone designations often listed in plant or seed catalog descriptions which can aid you in selecting the best varieties and most compatible plants for your growing region.
Last Frost Date
Once you know your planting zone, the next important thing to know when planning a vegetable garden is your first and last frost date estimates. Again these are not dates which can be exactly and infallibly predicted but they are good rough guidelines for when to expect the last frost in Spring and the first frost of the autumn.
While some vegetables like peas, carrots, kale, spinach and chard, to name a few, can and indeed should be planted before the last frost date in Spring, most require frost free nights in order to avoid plant damage.
Local County extension services will be a good source of first and last frost date, as well as the Farmer’s Almanac.
Determining the first and last frost date allows you to determine the number of days in your growing season. Last frost dates in April or May and first frost dates in October or November give you ample time to plant such long season crops as gourds, certain melons, and other long season vegetables.
Once you have determined the plant hardiness zone for your area and first and last frost date, you are well equipped to begin selecting the vegetables you want to grow in your garden.
Additionally, you will see that most seed and plant catalogs offer early, mid and late season varieties of many different vegetables. By knowing the length of your growing season, you can better select which varieties of which vegetables are best suited to your area.
Resources:
Farmer’s Almanac U.S. Frost Date Chart: http://www.almanac.com/content/frost-chart-united-states
USDA PHZM Site and supporting information: http://planthardiness.ars.usda.gov/PHZMWeb/About.aspx
The U.S. National Arboretum (USNA) website includes a list of cold hardiness ratings for selected woody plants which may be found at the following link: http://www.usna.usda.gov/Hardzone/hrdzon4.html#5.

